Histories of comparing binaries with source codes
Hi all!
Some months ago I started designing and writing a tool to do a simple thing: directly diff source codes against binaries. In the next paragraphs I will explain some of the problems I have discovered, how I managed to solve others, how I believe it’s almost impossible to fix some others as well as explain what is the current status of this tool.
Introduction: How I had the idea
(if you’re not interested in why I decided to write such a tool you can skip to the next section. If you’re just interested in having early access to the tool or knowing when is it going to be released, skip to the “ETA WEN?” section).
I had this idea various years ago when I had to reverse engineer a software that I will not name: diff source codes against binaries without having to build the source code, open the binaries in IDA and diffing both databases. When I had the idea, as I mentioned, I was reverse engineering some software, after unpacking and deobfuscating it + manually fixing some things here and there, I had an IDA database that I could work with. However, I had thousands of functions to analyse. Searching in the internet I noticed that there was a leak of partial source code from more than 10 years ago. So, I downloaded that leak, unpacked the archive and tried to compile it so I could diff my target’s IDA database against the binary or binaries from the old leak. It was almost impossible to compile it. Surprise. The reasons were various:
- The compilers supported for building that code base dated from more than 10 years ago.
- There were various headers and libraries that were required for compilation or linking phases that I didn’t had, as the leak was partial.
- Even if I could somehow compile portions of the old source code, I would only be able to import symbols from those files that I managed to compile.
- Naturally, those source code files were the less complex and less important ones.
What I did in that case was to match some functions from the source files I managed to build to the functions in my target’s binary and, then, manually look for code references to rename things manually. And at this point I said to myself: “This is stupid, I should automate it somehow”. So, I wrote down the idea in my never-ending TODO list and decided that, some day, I would start working on it. It took me a few years to start this project.
Diffing source codes to binaries
When I started this project I already had an idea about how to write “diffing tools”, after writing and maintaining for various years Diaphora, but comparing binaries against binaries or sources against sources is kind of easy while comparing binaries against source codes, is not. In any case, I had the basic idea of how I should do this:
- Parse source codes and extract artifacts from source codes.
- Analyse IDA databases and extract from binaries the very same artifacts extracted from source codes.
- Develop heuristics to match functions in source codes to functions in binaries using the extracted artifacts.
- Finally, let the reverse engineer import matched functions, prototypes, enumerations and structures from the source codes to the binary.
And, basically, this is all this project does. But each step, especially dealing with source codes, has its own problems that are far from being trivial ones.
Parsing source codes
Parsing source codes is far from being an already solved problem. Yes, of course, parsers for many languages out there do exist. Yes, of course, one can write a parser for some programming languages easily. But is not the same supporting one dialect of one programming language than having to support all dialects of the programming languages that you want to support. For example: let’s say that you want to support C and C++ source codes. You will have to support at the very least the 3 major compilers supported features: the GCC, CLang and Microsoft Visual C++ supported syntax, which happens to be incompatible in some cases, especially when talking about Microsoft Visual C++. So, what can you do? You have 2 or 3 choices:
- Write a full parser (and either fail at doing so or never be done and hate yourself for years to come).
- Write a fuzzy parser (this is what the tool written by Fabian Yamaguchi “Joern” does). Has most of the same problems as before but with less rules as your parser doesn’t need to be a full blown parser.
- Use an existing compiler front-end instead of reinventing the wheel.
And this is what I did: use an existing compiler front-end. There aren’t too many options to choose from when talking about C and C++ source codes:
- Use PyCParser or some similarly rather basic parser. It might work for a quick prototype, but do not plan to use it ever for a real tool.
- Use GCCXML or something around GCC that you code yourself (don’t do that unless you like suffering).
- Use the CLang bindings. There are APIs and bindings for C, C++ and Python. It will support whatever CLang supports and it will not support whatever CLang doesn’t support.
- If you have a rich uncle in America or if you are in a University, use the Edison Design Group C/C++ front-end. The EDG C/C++ front-end is the best of the best front-end with no doubt. They support almost any compiler’s dialect, specific versions and even specific version bugs! Actually, many commercial compilers are just forks of EDG, like AIX xlC/C++ compilers or the Intel C++ compiler.
My first option was to try to get an open source license for the EDG front-end but after exchanging some e-mails nothing materialized. So, my only other viable choice was to use CLang. I decided to use the Python bindings so I could reuse code from Diaphora. Perhaps it wasn’t a great choice and I should have used the C/C++ APIs… but it doesn’t really matter.
Using the CLang Python Bindings
The CLang Python bindings are great for parsing C, C++ and Objective-C source codes. And what is even better: you don’t need to have full compilable source codes. The bindings will “swallow” almost anything they can understand. Especially when talking about C source codes, it will parse many source files and functions even when headers, for example, cannot be found. Of course, some functions will have no artifacts as they failed to compile/parse, but at least it doesn’t refuse to continue compiling/parsing other functions in the same source file, which lets me getting artifacts from partial source codes. Just what I want.
The following is an example of partial source codes that cannot be completely parsed (from the testing suite of the tool I’m writing) that shows how the CLang’s Python bindings deal with them:
#include <stdio.h>

static int g_something = 0;

static void __attribute__((always_inline)) foo(void)
{
  printf("Hello!\n");
}

// This function will fail to compile as the compiler doesn't know what
// is invalid_type_t
invalid_type_t failing_func(void)
{
  printf("I failez!\n");
}

void __inline set_something(int kk)
{
  int copy = kk;
  g_something = copy;
}
If we try to compile this file with CLang or any other compiler it will fail, naturally. But if we “parse” it with the CLang Python bindings, it will not completely fail. I will use the following Python script to compile the testing C file and printing out the Abstract Syntax Tree (AST) that the bindings use:
$ ./dump_ast.py test.c ""
test.c:18,1: error: unknown type name 'invalid_type_t'
CursorKind.TRANSLATION_UNIT 'test.c' '#'
(...)
CursorKind.FUNCTION_DECL INLINED? False 'int failing_func()' 'invalid_type_t'
CursorKind.COMPOUND_STMT '' '{'
CursorKind.CALL_EXPR 'printf' 'printf'
CursorKind.UNEXPOSED_EXPR 'printf' 'printf'
CursorKind.DECL_REF_EXPR 'printf' 'printf'
CursorKind.UNEXPOSED_EXPR '' '"I failez!\\n"'
CursorKind.UNEXPOSED_EXPR '' '"I failez!\\n"'
CursorKind.STRING_LITERAL '"I failez!\\n"' '"I failez!\\n"'
(...)
As we can see, the bindings continued parsing the function even when the type invalid_type_t cannot be resolved and we can still extract artifacts from this function, like the function called (printf) or the string constant used (“I failez\n”). This is all I want for this project: an AST I can use to extract ‘things’ even if the source code cannot be compiled to object file because there are missing dependencies.
And, now, we can move to the next step…
Extracting artifacts
After being able to deal with source codes (using the CLang Python bindings) and with binaries (using the IDA Python APIs) the next step is to extract artifacts from both binaries and source codes so we can later on use these artifacts for matching a function F in the source code to a function F’ in the binary. But, what artifacts can we extract? One of my first ideas was to extract ASTs from both source codes and binaries (by using the Hex-Rays decompiler) to perform a fuzzy comparison of both. It turned out to be a stupid idea. Why? I think it needs a whole new section to explain it…
Comparing ASTs from binaries and source codes
So, why it was a bad idea? Because the AST from a human’s written function and the AST generated by an optimizing decompiler from optimized compiler generated code are totally different. I will explain it in more detail: when a source file gets compiled the compiler front-end takes the source code and generates an AST, then the compiler translates the function to some sort of Intermediate Representation (IR), then it performs optimizations over the IR and, then, the compiler back-end generates the final code based on the optimized IR. Then, when we use the decompiler, it takes the output of the compiler, which is already optimized, performs various analysis of the function and its basic blocks, generates an IR based on the compiler generated assembly code, performs optimizations over the IR and, finally, the decompiler outputs pseudo-code. Whatever the programmer wrote after these 2 non information preserving steps is mostly lost at the AST level. It can be easily seen with a picture:
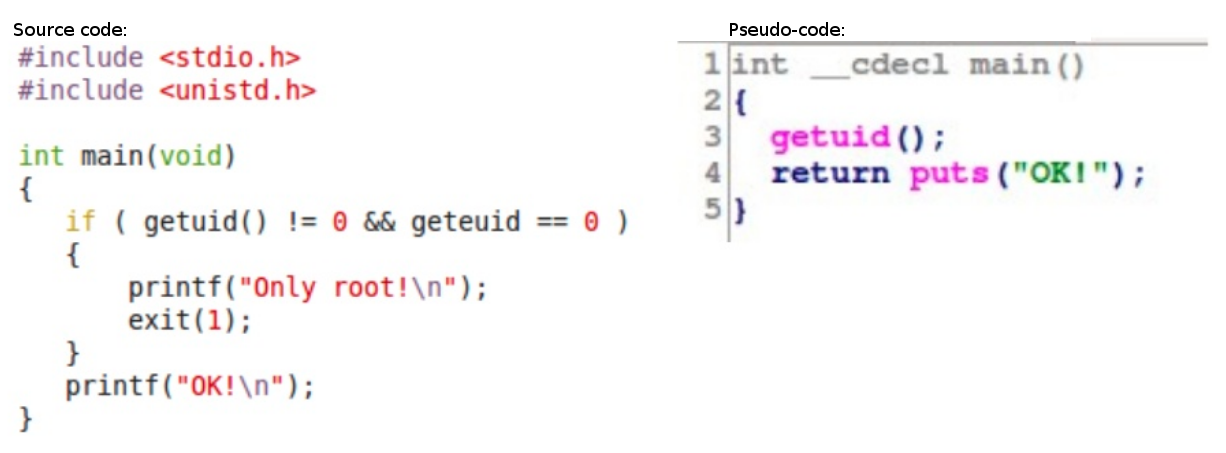
To the left, the source of a C function. To the right, the decompiler generated pseudo-code.
This picture shows the source code of a buggy C function (resembling an old privilege escalation bug in X11) and the generated pseudo-code. As we can see, the function geteuid is not called but rather its address is compared to zero. The compiler noticed it, it generated a warning or not, and finally, in the binary, the comparison was removed as the compiler knew before hand that the address of geteuid wasn’t ever zero. Then, the decompiler takes whatever the compiler generated, does its job, and generates a pseudo-code that, naturally, doesn’t reference the geteuid function, doesn’t include the printf(“Only root!\n”) call, etc…
This was just a trivial example of why a direct comparison of C code’s ASTs with pseudo-code’s ASTs is really a bad idea. So, when I realized I am stupid and that it wouldn’t work, I started thinking about other artifacts I could use for comparison.
Finding the appropriate artifacts for comparison
Believe it or not, it might very well be one of the hardest part of this project: what to extract to get a series of matches that I can trust. From my experiences in Diaphora, I decided to, perhaps, try to use again graphs related heuristics. As with the AST idea, it turned out to be yet another stupid idea (except for call graph related heuristics). Let’s say that, for example, we want to use the Control Flow Graphs (CFGs). As with ASTs extracted from human written code, CFGs generated from human written code are totally different to the CFGs we get after the compiler generates its output. It gets even worst when we consider that there can be various different optimization levels applied. As so, after a brief analysis of the data (and writing a quick CFG builder from ASTs that I had to drop), I decided that I couldn’t use pretty much any of the heuristics I use from Diaphora. Except the most rudimentary ones, like the number of conditionals, string and numeric constants, switch cases or the number of loops. These were the first “things” I started to extract for comparison. And it turned out that with these 4 easy to extract artifacts, I could have some initial matches. But what I think is more important: some initial matches with almost zero false positives!
The reasons behind why these artifacts are good for comparison are the following:
- A compiler might decide to apply constants folding, but it will not remove the constants, unless they only appear in a dead code path.
- If a source code function contains a loop with a non impossible condition in a non dead code path the compiler will generate a loop in most cases (the compiler might unroll the loop if it’s possible, but it will not happen in 100% of the cases).
- The number and values of a switch statement should be the same in both the binary and the source code if there aren’t impossible conditions, values or paths.
- Usually, the number of conditionals for small to medium functions doesn’t change or it only slightly changes.
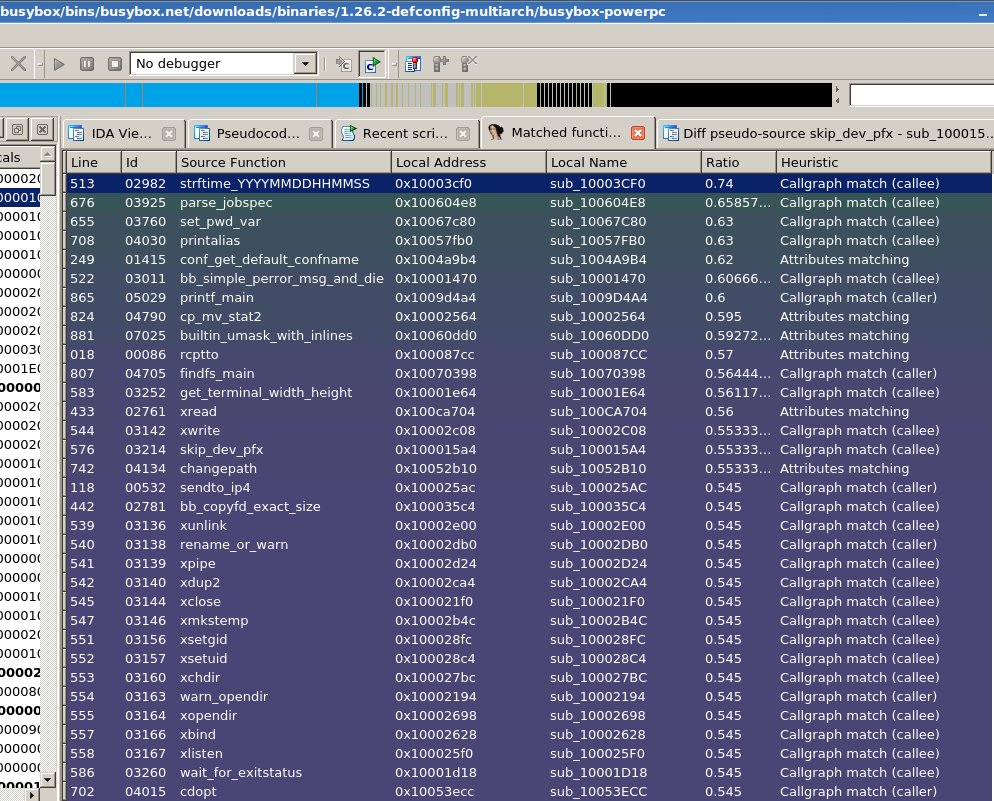
And, when I had my first initial matches with almost no false positives, I started writing an IDA Python based GUI so I could graphically see the matches.
Blind Visual Diffing
The next funny problem I found was the following: once I have a match and I show it in some sort of IDA’s GUI list (in a chooser), how can I visually diff both functions? The answer is easy if we have a decompiler: we “just” diff the source codes with the generated pseudo-code and that’s it. Well, it doesn’t usually quite work as shown in the following picture:
Diffing source codes against pseudo-codes.
But, even if it works (and it doesn’t in too many cases), how can we visually diff when the decompiler doesn’t support the processor architecture of our target? It doesn’t make any sense to show a diff of, say, PPC assembler and C source code. This is one of the various problems for which I have no solution. Perhaps one kind of a solution would be to display a list of what artifacts matched instead of source codes, but it will probably not be enough information as to rule out if the match is good or not.
Comparing apples to oranges
Another of the biggest problems I have had with this project is a common problem with diffing suites. Actually, I first experienced this problem with Diaphora. Once I have a match, how can I determine how reliable is it? It means writing a comparison function that takes as input a source code function’s extracted artifacts and a binary function’s extracted artifacts that outputs a ratio. It might sound easy but… how can I determine how close is a C function to a binary’s assembler function? In Diaphora, one of the ways for comparing 2 functions is to compare if their assembly or pseudo-code representation are similar. However, in this case I cannot do that for 2 reasons:
- I cannot directly compare assembler and source codes.
- In most of the cases, the number of differences comparing source codes with pseudo-codes is huge even for a 100% reliable match (like in the previous picture).
How I solved it? I haven’t. Or I just solved it partially: I assigned weights to each heuristic I have. However, I haven’t used any “scientific” approach to determine the weights. What I have used is manual analysis. Actually, this is another problem I have: how to automate the process of finding the proper weights for each heuristic. But this is a problem for another time…
I heard you like problems…
Another problem, another one I’m still dealing with, is how to properly import structures, enumerations and other pieces of interesting information from source codes to binaries. For example, let’s say that we have a good match and we want to import all relevant information from the source code to the binary. Now, consider the following good match:
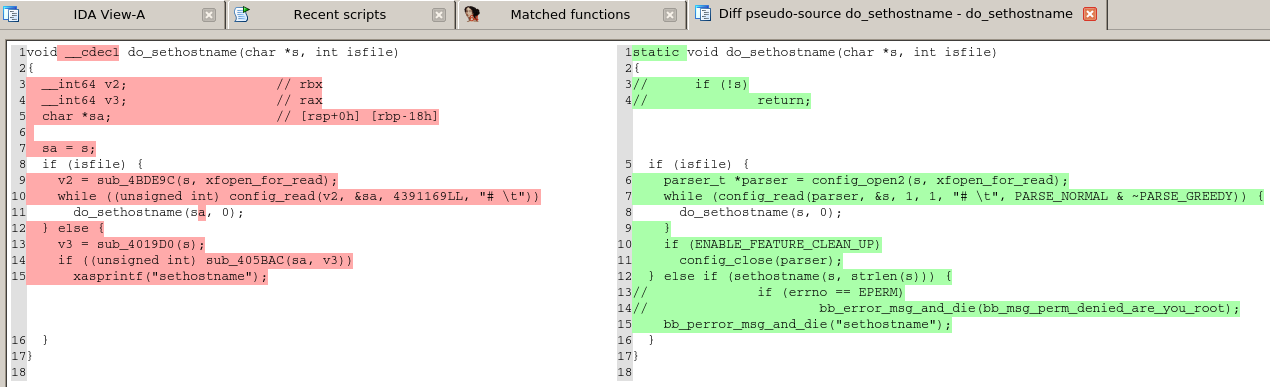
A match between the source code and the binary Busybox function do_sethostname().
As we can see in the source code version, there is a variable of type parser_t and, naturally, we would like to import the parser_t struct’s definition to our IDA database. First of all, we don’t know where is it, we have to find it. So, what we do? We check the include files. First problem: the current version of the CLang bindings don’t let you get a list of files included. OK, then the solution is another: just get that information when parsing source code files from all the files included. It’s possible, but it means that for any and all source files we have to parse also all include files (even the standard ones) making the parsing process really slow. Let’s say that we manage to only do it once, somehow, and we found the definition of parser_t. Now, let’s say that the struct contains other structures: we have to find them. Once we resolved all of them, we have to import them in IDA. It means having to create a dependency tree for the structs, so if struct A uses struct B and struct B uses struct C, we need to import first struct C then struct B to finally import struct A. In any case, that’s is more a programming problem than a real reverse engineering problem.
In-lined functions
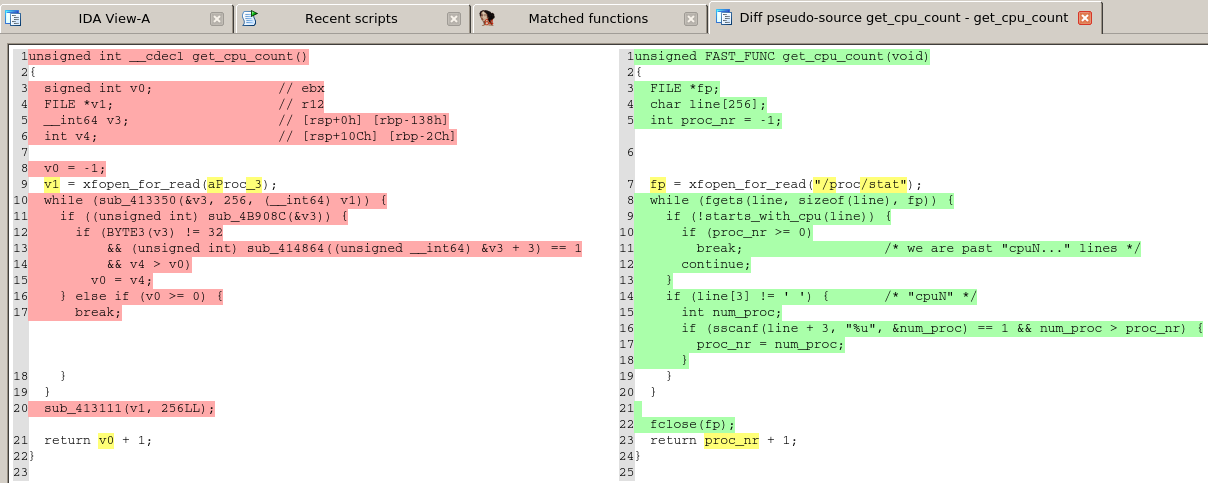
Yet another partial problem I’m dealing with: sometimes, functions are in-lined by compilers, sometimes humans hint the compiler to try to in-line the function whenever possible, but the compiler will decide if it will finally in-line the function or not. That means that some functions will be in-lined, thus, they will not appear in the binary as independent functions; other times, will be in-lined sometimes, thus, appearing inside other functions as well as independent functions, and we cannot rely on any of the compiler hints for in-lining functions (the inline, __inline, __forceinline, __attribute__((always_inline)), __please_inline, etc… and friends). It will cause some functions to match partially when they aren’t that same function. For example, consider the following functions:
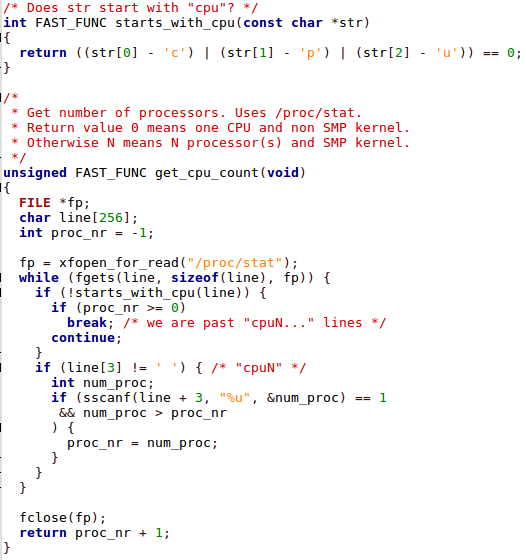
Some Busybox functions. One of them might get in-lined. Sometimes.
The function starts_with_cpu, sometimes, might get in-lined. As so, we might be wrongly matching this function with another one using the constants ‘c’, ‘p’ and ‘u’, and with one conditional, that has the function starts_with_cpu in-lined but doesn’t really do too much, thus, doesn’t make it complex enough as to make irrelevant these artifacts. Result: a false positive that is hard to detect automatically.
This is not a problem for which I have a solution that really works. For now. One of the solutions I considered was creating functions with various versions of in-line candidates inside. It caused the source code export times to explode and, in my tests, less than 1% of the functions with in-lines were matched. The code is there and the feature can be used, but it will not be enabled by default and, eventually, might get removed.
Another idea that I have to solve this problem, or at least a great percent of occurrences, is the following: Once I have a match that is not “100% perfect”, i.e., some rare and long enough string constants matched, but there are constants in the binary function that aren’t in the source function, try to search candidate in-line functions with these rare string constants and try to determine if combining both functions the comparison ratio is better. This way, I could find in-line functions at diffing time instead of at export time and only whenever I have a match that is relevant enough as to try to determine if it’s a function with one or more functions in-lined or not (because it will be a heavy operation).
What about C++?
I have no plans, at least not for now, to adapt it to support C++. Actually, I’m almost sure it cannot be used with non trivial C++. Why? A simple example: how many function calls are in the following C++ code?
void class::member(int a)
{
  CObj obj;
  obj.do_stuff(a);
}
Answer: we cannot determine it with the given information. For example, the constructor of CObj might call one, two or ten functions (or none), and we don’t have that information here. The destructor of CObj can do the same. So, either we analyse any and all classes and create various versions of each function with and without in-lined constructors and destructors, or it will not find good matches, if it finds any at all. And this is not the only problem of analyzing non trivial C++ codes, as I would have to deal with templates, virtual functions, etc… I don’t hate myself that much.
ETA WEN?
I will publish the tool and my slides to the general public during the conference Hacktivity 2018, on October 12th. The tool will be open sourced, most likely under GPL, as always. However, if you want to have early access to it, you can drop me an e-mail or send me a direct message using twitter (my handle is @matalaz), and I will give you access to the private Github repository.
And, that’s all! I hope you liked that really long post.